
Crude's Second Surge Meets a Market That Didn't Chase It
WTI up 9.7% and Brent 11.7% on a second week of geopolitical repricing, while managed money stayed short, credit stayed calm, and silver quietly outran gold. Weekly Commodity Report for July 20-26, 20

Summary
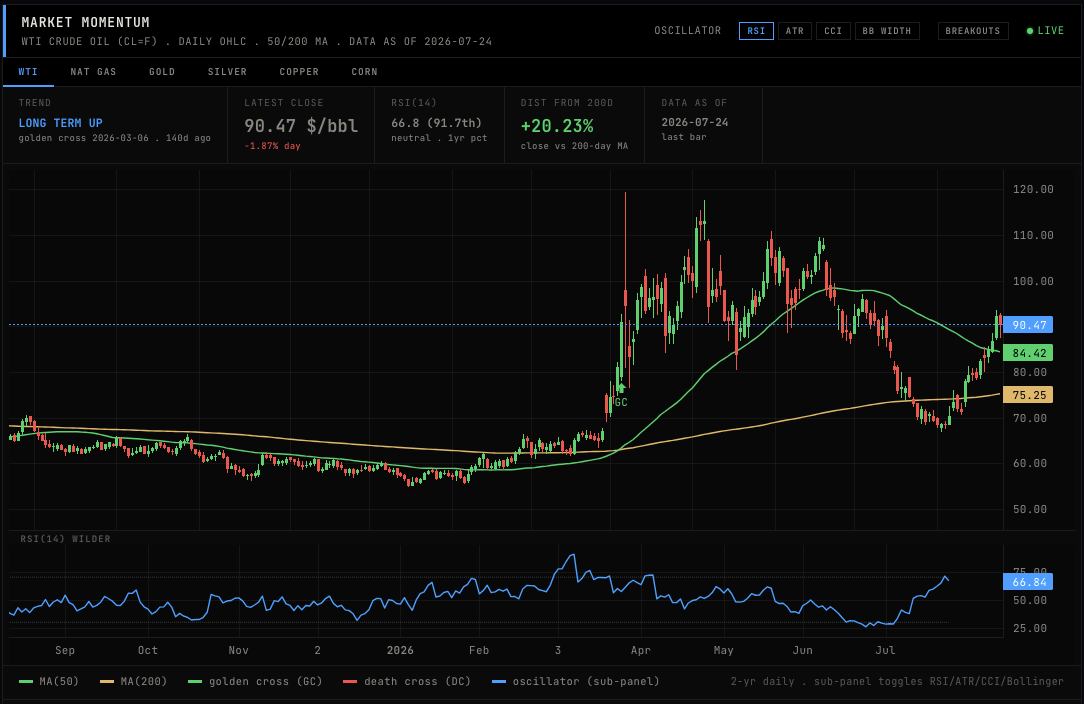
WTI surged +9.7% WoW to $90.47/bbl, the 35th largest gain of 246 weekly windows in the 1.9-year history, as Cushing stocks fell -3.4% WoW to 19,370 Mb while OPEC production held well below its 28.5 Mb/d quota; tightening domestic storage and a supply-constrained OPEC drove crude sharply higher for a second consecutive week.
Brent put on +11.7% WoW to $98.38/bbl, widening the Brent-WTI spread as the waterborne benchmark priced the geopolitical risk first; the GPR index jumped +31.8% WoW to 191.8, well above its 30-day moving average of 167.4.
Soybeans rose +4.0% WoW to 1252.50¢/bu with WASDE stocks-to-use at 7.70%, below the 10-year mean of 9.30%; the tightest balance sheet in the grain complex is where the bid concentrated.
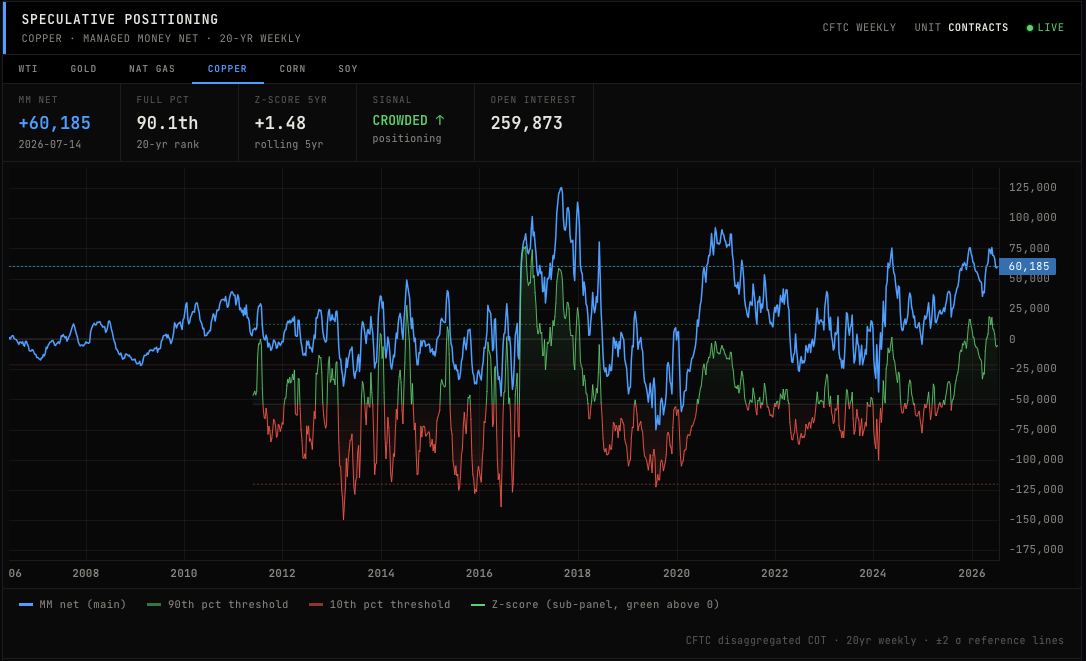
Copper reached $6.34/lb (+1.9% WoW) with managed-money Briese positioning at the 87.0 percentile, a crowded-long extreme that has historically preceded positioning-driven volatility.
VIX and MOVE both surged, +12.4% WoW and +13.0% WoW respectively, a multi-asset stress signal that arrived alongside the crude spike and geopolitical escalation. Credit did not blink.
Energy
WTI lunged nearly $8/bbl higher this week, closing at $90.47 (+9.7% WoW). Brent moved even harder, adding +11.7% WoW to $98.38/bbl. The Brent-WTI spread widened as the waterborne benchmark absorbed the geopolitical premium first, a pattern familiar from prior Persian Gulf stress episodes. The GPR index at 191.8 (+31.8% WoW, versus a 30-day MA of 167.4) provides the macro backdrop; crude did not invent this move.
Cushing stocks fell to 19,370 Mb (-3.4% WoW). For context, Cushing working capacity runs roughly 76 Mb, so 19,370 Mb represents about 25% utilization, a level that historically tightens prompt spreads and amplifies upward price moves. Total crude inventories at 411,675 Mb rose only +0.5% WoW, so the Cushing draw was localized rather than a system-wide tightening, but the prompt market prices Cushing, not the Gulf Coast.
OPEC production came in at 25.00 Mb/d (+0.1% WoW) against a quota of 28.5 Mb/d. That 3.5 Mb/d gap between quota and actual output is not a rounding error; it is the structural supply constraint that gave the geopolitical spike its legs. The next OPEC meeting is scheduled for 2026-08-02.
The 3-2-1 crack spread at $59.00/bbl sits at the 98th percentile of its history (median $26.57, max $69.45; n=1,257). Refining margins at this level, alongside a rising crude price, describe a market pricing simultaneous supply fear and demand resilience. That combination does not resolve quietly. Diesel retail hit $5.134/gal (+7.0% WoW), the physical economy’s most direct exposure to this week’s crude move.
Henry Hub natural gas barely moved, -0.3% WoW to $2.91/mmBtu, among the mildest weekly declines in the 1.9-year history. LNG exports fell -6.2% MoM to 537.90 Bcf. Gas is simply not participating in the energy rally. The Baltic Dry Index edged down -0.9% WoW to 2,725, offering no corroborating freight signal for the crude surge.
Agriculture
Soybeans carried the tight-balance-sheet story this week, rising +4.0% WoW to 1252.50¢/bu. The WASDE stocks-to-use for soy sits at 7.70% (+0.4pp MoM), below the 10-year mean of 9.30% and near the lower end of the 10-year range of 5.00-23.40%. Tight balance sheets amplify weather and demand signals. Soybean crop conditions at 66% good/excellent (+1pp WoW) are running above the 5-year average of 61%, so the price move is not a crop-condition story; it is a balance-sheet story.
Wheat slipped -0.5% WoW to 679.00¢/bu. Winter wheat conditions remain deeply stressed at 26% good/excellent, unchanged on the week, against a 5-year average of 44%, with 47% rated poor/very poor. The WASDE wheat stocks-to-use at 45.00% (+1.6pp MoM) sits almost exactly at the 10-year mean of 44.90%, which explains why the crop condition deterioration has not translated into a sustained price rally. Ample global supply is absorbing the domestic stress.
Corn at 487.25¢/bu is at its 52-week high. The WASDE corn stocks-to-use of 12.20% (+1.9pp MoM) is nearly at the 10-year mean of 12.30%, and crop conditions at 67% good/excellent (-1pp WoW) remain above the 5-year average of 65%. Planting is 97% complete, +1pp ahead of the 5-year average. The balance sheet is not tight. Corn ethanol use at 472 Mbu monthly provides a steady demand floor.
The FAO Food Price Index for June came in at 130.30 (-0.4% MoM). The cereals sub-index fell -3.5% MoM to 110.20, while oils jumped +3.8% MoM to 192.00. The oils surge, driven in part by palm oil dynamics, is the FAO story of the month. Dairy fell -1.5% MoM to 117.40.
Fertilizer input costs are softening at the margin: nitrogen PPI fell -1.8% MoM (FRED WPU0652013A) and ammonia PPI fell -1.9% MoM (FRED WPU06130212). World Bank Pinksheet urea at $736/t (+3.1% MoM) tells a slightly different story at the traded level, with potash collapsing -41.2% MoM to $453/t.
Metals & PGMs
Gold added +1.1% WoW to $4,055.70/oz against a backdrop of rising real rates (+4 bps WoW to 2.43%) and a firmer dollar (DXY +0.7% WoW to 101.47). Gold holding ground while real rates rise and the dollar strengthens is not the behavior of a metal responding to financial conditions; it is a metal absorbing geopolitical demand. The GPR spike of +31.8% WoW provides the mechanism. The gold/oil ratio at 45.39 (+3.4% WoW) sits at the 91st percentile of its full history (median 20.84; n=5,031), meaning crude is rising fast but gold is rising faster.
Silver outran gold, up +4.4% WoW to $58.49/oz. The gold/silver ratio fell to 69.38 (-0.9% WoW), sitting at the 44th percentile of full history (median 71.96; n=5,031). A falling gold/silver ratio with both metals rising describes industrial demand joining safe-haven demand. Silver is not just a hedge here.
Copper reached $6.34/lb (+1.9% WoW), leaving its 52-week high of $6.65 about 4.7% overhead. The copper/gold ratio at 1.5600 (+0.0% WoW) is at the 10th percentile of full history (median 2.2250; n=5,031), a historically depressed reading that has typically appeared when gold is pricing macro fear faster than copper is pricing growth.
The platinum/palladium ratio at 1.279 (platinum premium) reflects a platinum price of $1,631/oz against palladium at $1,275/oz. The platinum/gold ratio at 0.394 sits at the 6th percentile of full history (range 0.280 to 2.326, median 0.747; n=4,542). Platinum has rarely been this cheap relative to gold.
Risk & Macro
VIX at 18.70 (+12.4% WoW) and MOVE at 80.08 (+13.0% WoW) moved in lockstep. When equity volatility and bond volatility spike together, the signal is multi-asset stress, not sector rotation. OVX, the crude volatility index, added +5.6% WoW to 68.97, and GVZ (gold vol) rose +4.7% WoW to 25.14. Every major volatility surface repriced higher this week. The GPR at 191.8 (+31.8% WoW) is the common thread.
The real 10-year rate at 2.43% (+4 bps WoW) is not accommodative. Gold at $4,055.70 against a 2.43% real rate is a statement about how much geopolitical premium the market is willing to carry. The 10-year nominal yield stands at 4.47% with CPI at 3.46%, and the 10y-2y spread at 0.34% is a modestly positive curve, not a recession signal.
The dollar firmed, with DXY +0.7% WoW to 101.47 and the Broad Dollar Index +0.2% WoW to 120.53. A stronger dollar is typically a headwind for dollar-denominated commodities; the fact that crude and gold both rallied hard into dollar strength underscores the geopolitical rather than financial character of this week’s moves.
IG credit spreads widened only +1 bps WoW to 79 bps. Credit is not panicking. The divergence between surging commodity volatility and contained credit spreads is the macro puzzle of the week.
Positioning
The positioning tape is running behind the price tape in energy. Managed money in WTI cut net length by 2,067 contracts to 61,974 with a Briese score at the 29.5 percentile, a crowded-short reading, even as price surged +9.7% WoW. That is a significant divergence: the hot money was not positioned for this rally and has not yet chased it.
Natural gas positioning is more extreme. Managed money added 45,414 contracts of net short exposure, pushing the net to -105,709 contracts with a Briese score at the 20.4 percentile, deep in crowded-short territory, against a market that barely moved (-0.3% WoW). The short position is large relative to open interest of 1,663,336 contracts.
Copper managed money sits at 60,185 net long with a Briese score at the 87.0 percentile, a crowded-long reading. Open interest is 259,873 contracts. A Briese score at this level, with price near a 52-week high, describes a market where the long side is well-populated and incremental buying requires new fundamental justification.
In grains, corn saw a 26,360-contract swing to 11,361 net long (Briese 51.2, neutral), and wheat added 25,545 contracts to -34,887 net short (Briese 65.7, neutral). Both moves are large in absolute terms but land in neutral territory on the normalized scale.
The CBOE put/call ratio on GLD collapsed -55.8% WoW to 1.26, and on SLV fell -51.3% WoW to 0.57. Options traders are not buying gold and silver protection; they are buying exposure. GDX put/call fell -74.8% WoW to 0.28. USO put/call rose +28.3% WoW to 0.77, the one options market where hedging demand increased alongside the price spike.
As Well As
OFAC SDN designations reached 1,262 new names in the past 7 days and 4,645 over 30 days, with 840 commodity-tagged designations in 7 days, an elevated designation pace; CENTRO DE INVESTIGACIONES DEL PETROLEO S.A. appears among the recent commodity-relevant entries. The next OPEC meeting is scheduled for 2026-08-02, the first since the group’s 2026-07-05 decision to raise August output, with actual production running 3.5 Mb/d below the 28.5 Mb/d quota. World Bank Pinksheet potash fell -41.2% MoM to $453/t while urea rose +3.1% MoM to $736/t, a divergence in the fertilizer complex that complicates input cost forecasting for the fall application season. LNG Japan spot prices fell -6.2% MoM to $15.17/mmBtu, tracking the decline in US LNG export volumes (-6.2% MoM to 537.90 Bcf). The FAO oils sub-index rose +3.8% MoM to 192.00 while cereals fell -3.5% MoM, a split that describes food inflation rotating from grains toward fats and oils.