
Gold Goes Vertical While Crude Breaks Down
Gold +7.4% to $4,401 and silver +10.4% as geopolitical risk spikes, while WTI drops 9% on a Cushing build and collapsing refining margins. Weekly Commodity Report for August 3-9, 2026.

Summary
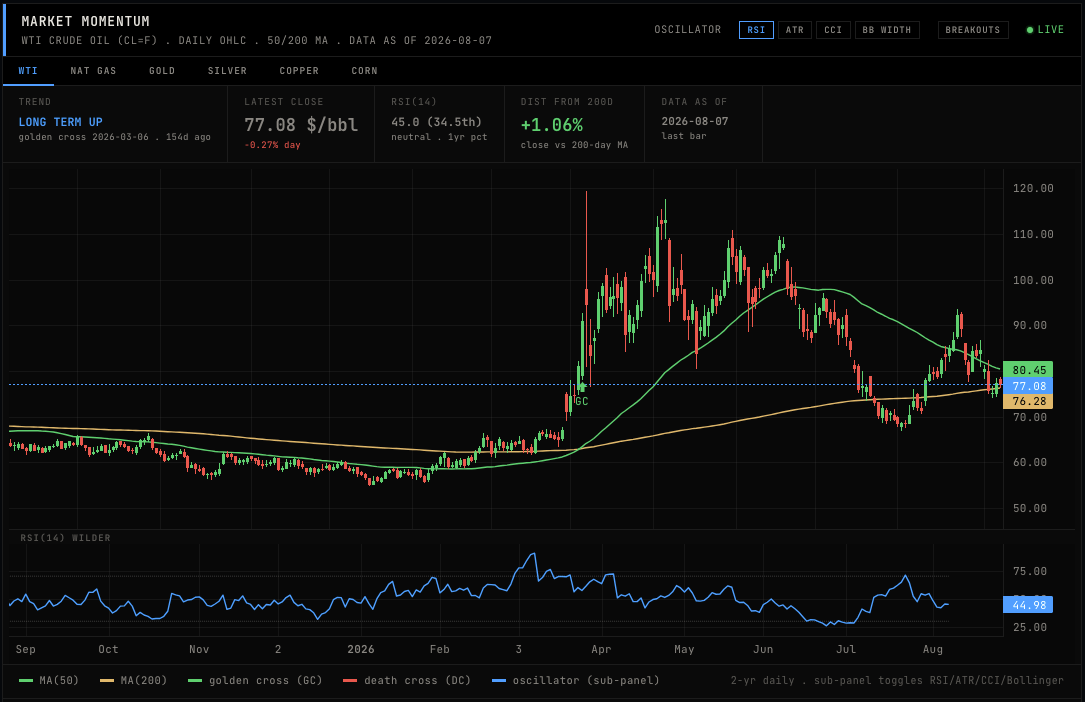
WTI crude shed $7.62/bbl (-9.0% WoW) to $77.08 in a week that opened with Washington calling off a planned strike on Iran and signaling a presumed return to negotiations; Cushing stocks surged (+12.7% WoW) and the 3-2-1 crack spread collapsed (-12.2% WoW) in tandem, and crude and margins falling together is the signature of demand anxiety, not supply disruption.
Gold lunged to $4,401.30/oz (+7.4% WoW) even as real rates ticked up (+2 bps WoW) and the dollar held near flat (-0.2% WoW), a combination that historically points to safe-haven demand overwhelming the rate-sensitivity channel; silver ran harder still (+10.4% WoW), compressing the gold/silver ratio to 68.99.
Geopolitical risk spiked hard, with the GPR index rising +15.0% WoW to 225.2 against a 30-day moving average of 184.3; a gap of that magnitude between spot and trend has historically preceded either a rapid mean-reversion or a sustained repricing of the risk premium.
Cotton crop conditions deteriorated to 42% good/excellent (-4pp WoW) against a 5-year average of 47%, compounding a season already running below par, while corn conditions slipped (-2pp WoW) to 61% against a 64% average.
Copper positioning held an extreme crowded-long reading even as the copper/gold ratio fell -5.1% WoW to the 10th percentile of its full history: the metal and the money are pointing in opposite directions. Something has to give.
Energy
The $7.62/bbl collapse in WTI (-9.0% WoW to $77.08) was not a drift; it was a break. The week opened with Washington calling off a planned strike on Iran and signaling a presumed return to negotiations, and crude spent the sessions that followed unwinding war premium. Brent fell -6.4% WoW to $82.27, leaving the Brent-WTI spread at $5.19/bbl, wide enough to reflect the waterborne barrel pricing in some residual geopolitical premium while the landlocked benchmark absorbed the full weight of a domestic inventory shock. Cushing stocks jumped +12.7% WoW to 20,955 Mb (for context, Cushing working capacity is roughly 76 Mb, so this represents about 28% utilization, but the rate of build is what matters: a 12.7% weekly surge is a physical signal, not noise). Nationwide crude inventories added +0.6% WoW to 406,987 Mb, a modest headline that understates the Cushing story.
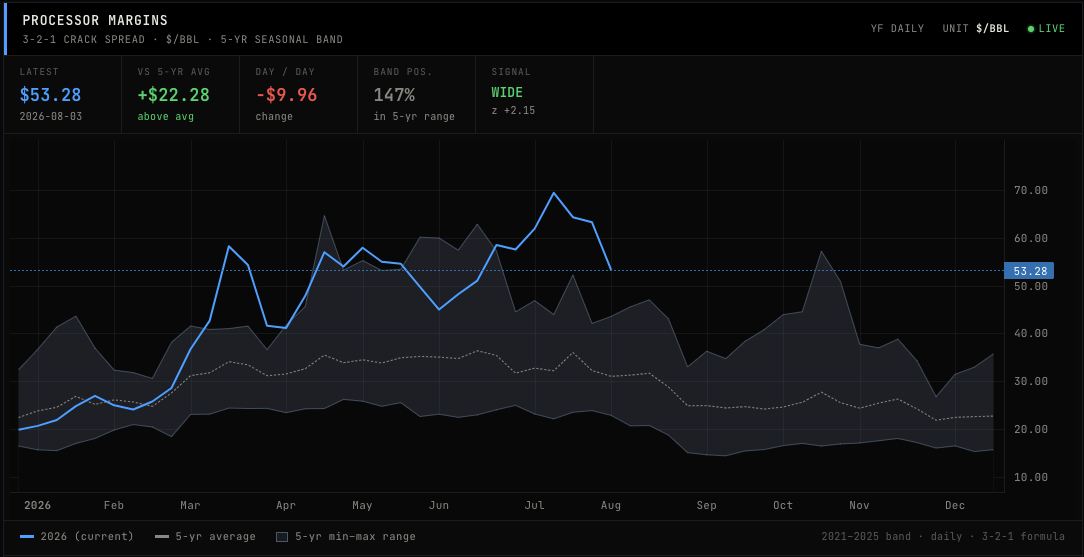
The 3-2-1 crack spread fell -12.2% WoW to $53.28/bbl. That number still sits at the 93rd percentile of its full history (min $14.37, median $26.73, max $72.22), so refining margins remain structurally elevated even after the week’s damage. But crude and cracks falling together is the demand-fear configuration: refiners are not being squeezed by input costs, they are being squeezed by the prospect of weaker product demand. RBOB gasoline confirmed it, dropping -14.4% WoW to $2.71/gal. Retail diesel, however, edged up +0.7% WoW to $5.348/gal, a divergence between wholesale and retail that tends to close with a lag.
OPEC production held at 25.00 Mb/d (+0.1% WoW), essentially flat. US production also barely moved, +0.1% WoW to 13,804 Mb/d. The supply side did not cause this week’s price action. The Cushing build and the crack collapse did.
Henry Hub natural gas fell -4.3% WoW to $2.67/mmBtu. LNG exports pulled back -6.5% MoM to 502.80 Bcf (monthly), a meaningful reduction in the export outlet that has been supporting domestic gas prices through much of the year. The Baltic Dry Index jumped +14.4% WoW to 3,057, a sharp firming in dry bulk freight worth watching against the backdrop of rerouted trade.
The gold/oil ratio reached 57.30 (+18.2% WoW), sitting at the 96th percentile of its full history (median 20.92); a ratio this stretched has historically meant either crude is deeply undervalued, gold is deeply overvalued, or both narratives are running simultaneously.
Agriculture
Grain prices were largely becalmed this week. Corn eased -0.5% WoW to 461.50¢/bu; soybeans slipped -1.0% WoW to 1,176.00¢/bu; wheat was unchanged at 638.25¢/bu (+0.0% WoW). The WASDE supply/use ratios explain the quiet: corn S/U at 12.20% sits just below the 10-year mean of 12.30% (10-year range 8.30-15.70%), wheat S/U at 45.00% is essentially on the 10-year mean of 44.90% (range 30.40-55.50%), and soy S/U at 7.70% is below the 10-year mean of 9.30% (range 5.00-23.40%). None of these readings are screaming tightness or surplus. Soy is the one to note: 7.70% is the tightest of the three relative to its mean, and the +0.4pp MoM improvement is the smallest of the three crops.
Crop conditions told a more differentiated story. Corn good/excellent fell to 61% (-2pp WoW) against a 5-year average of 64%, with poor/very poor at 14%. Soybean conditions held at 63% (+0pp WoW), fractionally above the 5-year average of 62%. Spring wheat improved to 55% G/E (+2pp WoW), now running above its 5-year average of 48%. Cotton is the outlier: 42% G/E (-4pp WoW) against a 5-year average of 47%, with poor/very poor at 20%. A season running 5 percentage points below average with deteriorating weekly readings is a crop under stress.
The FAO Food Price Index for June came in at 130.30 (-0.4% MoM). Within that, cereals fell -3.5% MoM to 110.20 and dairy fell -1.5% MoM to 117.40, while oils surged +3.8% MoM to 192.00. The oils component is the outlier, and the World Bank Pinksheet points away from palm as the driver: palm oil fell to $1,689/t in the August edition (from $1,815 in July), which means the FAO oils surge was carried by other vegetable oils.
Fertilizer input costs continued to ease. Nitrogen PPI (FRED WPU0652013A) fell -1.8% MoM to 639.16; ammonia PPI (FRED WPU06130212) fell -1.9% MoM to 176.69. World Bank Pinksheet urea dropped -2.2% MoM to $720/t and potash fell -11.7% MoM to $400/t, more input cost relief than urea or the nitrogen PPIs delivered this month. For a crop sector watching input margins, this is a meaningful tailwind, though the cotton crop condition data suggests weather stress is the binding constraint this season, not fertilizer cost.
Metals & PGMs
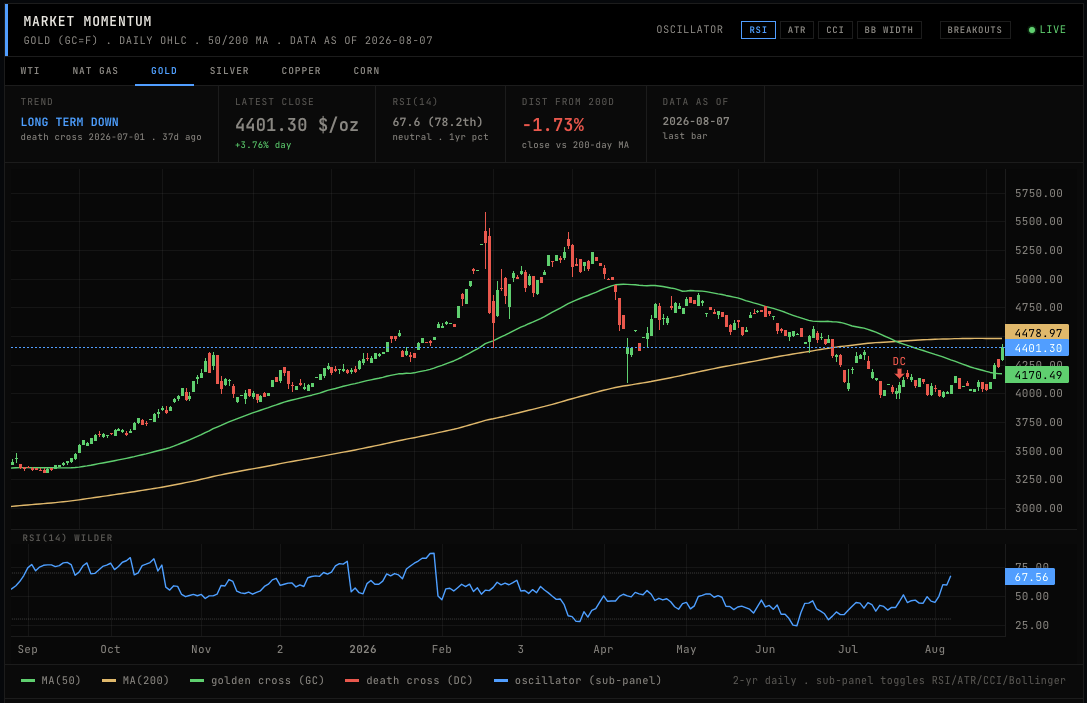
Gold at $4,401.30/oz (+7.4% WoW) is the week’s dominant story. Real rates moved against it, ticking up +2 bps WoW to 2.43%, and the dollar barely moved (-0.2% WoW on DXY). Gold rallying hard into a rising real rate environment is not the textbook trade. The GPR index surging +15.0% WoW to 225.2 is the more plausible mechanism: safe-haven demand overwhelming the rate-sensitivity channel. The gold/oil ratio at 57.30 sits at the 96th percentile of its full history. The platinum/gold ratio at 0.404 sits at the 8th percentile of its full history (range 0.280 to 2.326, median 0.747), meaning gold’s outperformance over platinum is near historic extremes.
Silver ran harder, +10.4% WoW to $63.80/oz. The gold/silver ratio compressed -2.4% WoW to 68.99, still near the 45th percentile of its full history (range 32.00 to 125.89, median 71.96). Both metals surging with the ratio compressing points to broad precious metals demand with silver carrying the extra gear, industrial and safe-haven bids running together.
Copper added +1.2% WoW to $6.58/lb. Modest on the surface. But the copper/gold ratio fell -5.1% WoW to 1.5000, now at the 10th percentile of its full history (range 1.1090 to 5.9860, median 2.2230). That ratio is a proxy for growth expectations relative to fear. At the 10th percentile, it is saying fear is winning. LME stock data was not available this week.
Platinum at $1,758/oz and palladium at $1,379/oz produce a Pt/Pd ratio of 1.275, platinum at a premium. Historically, platinum premiums above 1.0 have coincided with periods of palladium supply constraint or platinum demand recovery in auto catalysts; the current reading is consistent with a market still repricing the diesel/gasoline catalyst mix.
Risk & Macro
The risk picture this week is contradictory in an instructive way. VIX fell -11.4% WoW to 15.15, a reading that signals equity market calm. MOVE at 76.12 is subdued for bond volatility. IG credit spreads tightened -2 bps WoW to 78.00 bps. By every financial-market stress indicator, the week looked orderly.
The GPR index at 225.2 (+15.0% WoW) against a 30-day moving average of 184.3 tells a different story. A 22% gap between spot GPR and its trend is not a rounding error. Geopolitical risk is spiking while financial markets are calm: that divergence is either a leading indicator for financial stress or a sign that markets have decided the geopolitical events are not commodity-supply-relevant. Gold’s +7.4% WoW move suggests at least one market is not so sanguine.
OVX (crude oil volatility) fell -9.6% WoW to 57.34, even as crude itself dropped -9.0% WoW. Volatility falling into a large price decline is a market accepting a new price, not arguing about direction. GVZ (gold volatility) rose +1.6% WoW to 24.86, a modest uptick that is proportionate to gold’s move.
The real rate at 2.43% (+2 bps WoW) remains the structural headwind for commodities broadly. CPI at 3.46% YoY against a Fed Funds rate of 3.63% leaves real policy rates barely positive. The 10-year at 4.60% with a 10y-2y spread of 0.44% is a curve that has steepened modestly. TPU (trade policy uncertainty) at 194.9 as of July 2026 and GSCPI at 0.80 as of July 2026 (above zero means supply chains are tighter than average) are background conditions that keep commodity supply chains from being fully relaxed.
Positioning
CFTC data below is dated August 4, the most recent Tuesday report; the copper reading is as of July 28 pending the fresh print. The positioning tape this week is full of divergences. Start with copper: managed money net long at 65,008 contracts as of July 28 with a Briese score of 91.0 (crowded long, extreme). The CROWDED_LONG signal is flagged. Meanwhile, the copper/gold ratio fell -5.1% WoW to the 10th percentile of its history. Extreme long positioning in a metal whose macro proxy is at a decade low is a tension the tape will eventually resolve.
WTI saw managed money add 28,964 contracts WoW to a net of 92,943, yet the Briese score sits at only 38.6 (neutral). That means the absolute net long is not historically stretched even after a large weekly addition. Managed money bought into a -9.0% WoW price decline. That is a positioning bet against the tape, not a momentum chase.
Natural gas managed money net is -105,826 contracts (-3,070 WoW), Briese at 20.4 (crowded short). The short is not growing rapidly, but it is entrenched. With Henry Hub at $2.67/mmBtu and LNG exports pulling back -6.5% MoM, the fundamental backdrop is not yet forcing a cover.
Wheat managed money covered further to -8,163 net contracts, but the Briese score is 85.4 (crowded long), and the BEARISH_DIVERGENCE signal is flagged. A crowded-long Briese reading with a small net short position means the commercial side is positioned against the managed money crowd. Wheat price was flat (+0.0% WoW); the divergence is unresolved.
Soybeans at Briese 82.5 (crowded long) with a BEARISH_DIVERGENCE signal, and a net long of 160,479 contracts (+29,974 WoW) against soy S/U at 7.70% (below the 10-year mean of 9.30%): the fundamental tightness supports the long, but the crowded positioning is the risk.
Options sentiment shifted sharply. The GLD put/call ratio collapsed -59.6% WoW to 0.36, SLV fell -28.2% WoW to 0.28, and GDX fell -39.7% WoW to 0.41: options markets are not hedging the gold rally, they are chasing it with calls. USO put/call rose +20.5% WoW to 0.94, nearly at parity, meaning crude options markets are buying downside protection into the price decline.
As Well As
OFAC SDN designations ran at an elevated pace, with 1,690 new designations in the past 7 days and 1,075 of those commodity-tagged, bringing the total SDN list to 19,199; the commodity-tagging rate of 64% is high relative to the overall list composition; World Bank Pinksheet LNG Japan surged +19.1% MoM to $18.06/mmBtu, a sharp move that contrasts with the -6.5% MoM decline in US LNG exports and points to tightening demand at the destination end; potash fell -11.7% MoM to $400/t on the World Bank Pinksheet, notable input cost relief for the fall application season; corn ethanol use of 467 Mbu (monthly) provides a demand floor for corn that partially offsets the modest price softness; the next WASDE release will update 2025/26 supply/use estimates and is the key agricultural calendar event for the period ahead; OPEC’s production and quota posture remains the standing context for any crude price recovery attempt after this week’s -9.0% WoW decline.