
The Premium Leaves, the Floor Stays
Crude gives back half its surge and grains break hard, while copper's paper bid stretches to a 96.5th-percentile extreme and sanctions keep a policy floor under risk. Weekly Commodity Report for July

Summary
Brent crude shed $8.28/bbl (-8.4% WoW) while WTI fell $3.67/bbl (-4.1% WoW), the spread between them compressing sharply as OPEC production held near 25.00 Mb/d against a 28.5 Mb/d quota, a gap that has persisted long enough to stop looking like restraint and start looking like structural ceiling.
Grain markets collapsed across the board, with wheat off -5.9% WoW, soybeans -5.1% WoW, and corn -4.8% WoW, as WASDE stock-to-use ratios for all three crops sit near or above their 10-year means and crop conditions held broadly steady through the growing season.
Copper climbed +2.7% WoW to $6.51/lb even as the broader commodity complex sold off, with managed-money Briese positioning at the 96.5th percentile, an extreme reading that has historically preceded sharp reversals when the physical market fails to validate the paper bid.
Gold held near record territory at $4,098.60/oz (+1.1% WoW) as the dollar weakened (-1.6% WoW on DXY) and real rates edged down (-2 bps WoW), while the gold/oil ratio extended its historically elevated position.
Geopolitical risk stayed elevated: GPR at 195.9 (+2.1% WoW) holds well above its 30-day moving average of 174.8, and OFAC commodity-tagged SDN designations continued at a pace of nearly 1,000 per week. Risk did not leave with the price.
Energy
Brent crude took the harder blow this week, falling $8.28/bbl (-8.4% WoW) to $90.12/bbl, while WTI declined $3.67/bbl (-4.1% WoW) to $86.80/bbl. The spread between the two benchmarks narrowed considerably, a configuration that tends to appear when seaborne risk premium deflates faster than domestic fundamentals. OPEC production ticked up just +0.1% WoW to 25.00 Mb/d against a quota of 28.5 Mb/d, leaving 3.5 Mb/d of nominal headroom that the group has shown no appetite to fill. That gap is not discipline; it is capacity reality dressed in quota language.
Crude inventories drew again, falling -1.7% WoW to 404,508 Mb, and Cushing stocks dropped a sharper -4.0% WoW to 18,599 Mb (for context, Cushing working capacity runs roughly 76 Mb, so 18,599 Mb represents approximately 24% utilization, a level that historically tightens WTI basis). US production was essentially flat at 13,796 Mb/d (-0.0% WoW).
Refining margins refused to follow crude lower. The 3-2-1 crack spread widened +2.9% WoW to $60.71/bbl, sitting at the 98th percentile of its full history (min $14.37, median $26.67, max $72.22; n=1,257), more than double its long-run median. Crack spreads rising while crude falls is a specific configuration: it points to product demand holding even as the raw barrel softens, which keeps retail prices stickier than the crude move alone would imply. Diesel retail confirmed that: $5.313/gal, up +3.5% WoW.
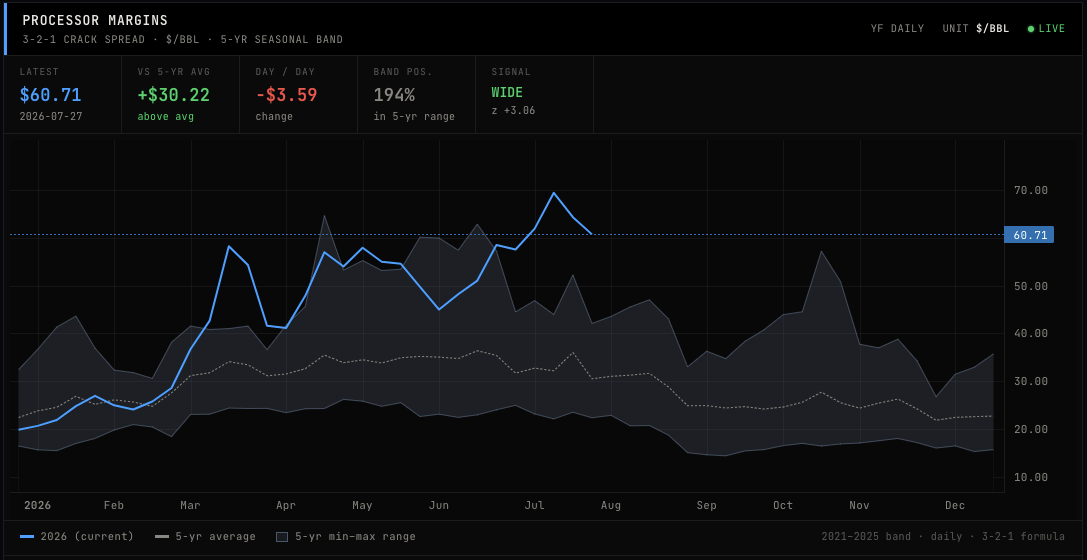
RBOB gasoline eased -3.1% WoW to $3.17/gal, a modest concession given the crude decline. LNG exports fell -6.5% MoM to 502.80 Bcf. Henry Hub natural gas eased -4.1% WoW to $2.79/mmBtu, still well below its 52-week high of $7.46 and only modestly above its 52-week low of $2.52. The Baltic Dry Index edged up +0.5% WoW to 2,673, offering no signal of freight stress in either direction. OPEC’s next scheduled meeting is 2026-08-02.
Agriculture
Grain prices broke hard this week. Wheat led the decline at -5.9% WoW to 638.00¢/bu, soybeans followed at -5.1% WoW to 1,188.25¢/bu, and corn dropped -4.8% WoW to 463.75¢/bu. The WASDE supply context explains the pressure: corn stock-to-use at 12.20% (+1.9pp MoM) sits almost exactly at its 10-year mean of 12.30%; wheat S/U at 45.00% (+1.6pp MoM) is essentially on top of its 10-year mean of 44.90%; soy S/U at 7.70% (+0.4pp MoM) remains below its 10-year mean of 9.30% but is trending toward it. None of these readings justify a scarcity premium.
Crop conditions added nuance without reversing the bearish supply picture. Corn rated good/excellent fell to 63% (-4pp WoW), now just below the 5-year average of 64%. Soybeans held at 63% G/E (-3pp WoW), fractionally above the 5-year average of 62%. Winter wheat remains deeply troubled at 26% G/E, unchanged WoW against a 5-year average of 44%, with 47% rated poor/very poor. But winter wheat is already harvested; its condition rating is a lagging artifact, not a forward crop signal.
Planting is effectively complete: corn at 97% planted (+1pp vs 5-year average), soybeans at 95% (+1pp), cotton at 97% (+1pp). The crop is in the ground and the calendar is moving toward pollination risk windows for corn.
The FAO Food Price Index for June came in at 130.30 (-0.4% MoM). Cereals fell -3.5% MoM to 110.20, consistent with the grain price weakness visible in futures. Oils rose +3.8% MoM to 192.00, with palm oil at $1,815/t (-0.9% MoM) providing only partial offset. Dairy eased -1.5% MoM to 117.40.
Fertilizer input costs continued to soften: nitrogen PPI (FRED WPU0652013A) fell -1.8% MoM to 639.16 and ammonia PPI (FRED WPU06130212) fell -1.9% MoM to 176.69. World Bank pinksheet potash dropped sharply to $453/t (-41.2% MoM), a move of that magnitude in a single month that compresses input cost pressure heading into the next planting cycle. Urea rose +3.1% MoM to $736/t, a partial offset.
Metals & PGMs
Copper was the week’s most pointed divergence. Up +2.7% WoW to $6.51/lb while crude, grains, and the dollar all sold off, the red metal moved against the commodity tide. LME stock data was not available this week. The copper/gold ratio at 1.5900 sits at the 11th percentile of its full history (range 1.1090 to 5.9860, median 2.2240; n=5,031), which historically has appeared during periods of compressed industrial demand expectations relative to safe-haven demand. Copper rallying from that depressed ratio baseline is notable; copper rallying into a 96.5th-percentile managed-money Briese score is a different matter entirely (more on that in Positioning).
Gold added +1.1% WoW to $4,098.60/oz, a modest nominal gain but one that keeps the metal within striking distance of its 52-week high of $5,318.40. The mechanism is legible: DXY fell -1.6% WoW to 99.80, real rates edged down -2 bps WoW to 2.41%, and geopolitical risk remains structurally elevated. The gold/oil ratio at 48.47 sits at the 92nd percentile of its full history (range -45.22 to 167.65, median 20.90; n=5,031). Gold is expensive relative to crude by almost any historical measure.
Silver slipped -1.2% WoW to $57.77/oz. The gold/silver ratio widened to 70.67 (+1.4% WoW), sitting near the 47th percentile of its full history (range 32.00 to 125.89, median 71.96; n=5,031). A ratio near median with gold holding and silver softening points toward safe-haven demand carrying gold rather than industrial demand pulling both metals higher together.
The platinum/palladium ratio at 1.264 keeps platinum at a premium to palladium. The platinum/gold ratio at 0.404 sits at the 8th percentile of its full history (range 0.280 to 2.326, median 0.747; n=4,543). Within that window, platinum has rarely been this cheap relative to gold.
Risk & Macro
The risk environment sent a mixed signal this week. VIX fell -8.6% WoW to 17.09, a level that sits in the “complacent” zone by most historical standards. MOVE at 77.09 is not alarming in isolation, and with both equity and bond volatility settling back, multi-asset stress is retreating; the question is whether the retreat is durable or a pause.
The dollar weakened meaningfully. DXY fell -1.6% WoW to 99.80; the Broad Dollar Index (DTWEXBGS) eased -0.2% WoW to 120.71. Dollar weakness of this magnitude in a single week is a tailwind for dollar-denominated commodities, and it helps explain gold’s resilience and copper’s bid even as other commodity prices fell.
Real rates at 2.41% (-2 bps WoW) remain restrictive in absolute terms. CPI at 3.46% YoY against a Fed Funds rate of 3.63% leaves real policy rates barely positive, the 10-year nominal yield stands at 4.47%, and the 10y-2y spread at 0.47% is modestly positive, no longer inverted.
GPR at 195.9 (+2.1% WoW) sits well above its 30-day moving average of 174.8. The OFAC sanctions velocity tells a parallel story: 989 commodity-tagged designations in the past 7 days, with Persian Gulf marine entities among the recent additions (HORMUZSAFE MARINE SERVICES AUTHORITY, PERSIAN GULF MARINE INSURANCE COMPANY). Strait of Hormuz-adjacent designations at this pace keep a structural floor under crude risk premium even as spot prices fall. OVX fell -8.0% WoW to 63.44, and GVZ eased -2.6% WoW to 24.48. Volatility is coming in, but OVX at 63.44 is not a calm market.
IG credit spreads widened just +1 bps WoW to 80 bps. Credit is not flashing stress.
Positioning
The copper positioning extreme is the week’s sharpest structural observation. Managed money net long in copper stands at 71,515 contracts (+11,330 WoW) with a Briese score at the 96.5th percentile, an extreme crowded-long reading against open interest of 270,048 contracts. That is not a crowded position; it is a compressed spring. Historically, Briese readings above 90 in copper have resolved through price, not through further accumulation. The physical market will need to validate this paper bid, and LME stock data was unavailable this week to confirm whether it is doing so.
Wheat managed money flipped hard: net position moved to -18,399 contracts (+16,488 WoW), yet the Briese score sits at the 77.8th percentile, a crowded-long reading. That combination, a still-net-short position with a crowded-long Briese, reflects a rapid short-covering event rather than fresh longs entering. Soybeans show a similar dynamic: net long 130,505 contracts (+55,314 WoW), Briese at the 75.3th percentile. Both grain markets saw massive repositioning into a week of falling prices, a divergence between paper flow and physical price that rarely persists.
Natural gas managed money remains crowded short at the 21.5th percentile, net -102,756 contracts (+2,953 WoW). The short position held as Henry Hub eased -4.1% WoW; so far, it is being paid.
WTI positioning is neutral at the 30.1th percentile. Gold at the 61.7th percentile is unremarkable. Silver at the 34.7th percentile is neutral.
The GLD put/call ratio collapsed -29.4% WoW to 0.89, and SLV fell -31.6% WoW to 0.39. Options markets are not hedging gold or silver downside. GDX put/call surged +142.9% WoW to 0.68, a sharp one-week reversal in miners’ options sentiment that stands in contrast to gold’s steady price.
As Well As
OPEC’s next scheduled meeting falls on 2026-08-02, the final day of this report’s window, making the production-versus-quota dynamic the immediate forward event for crude pricing; the group has held at 25.00 Mb/d against a 28.5 Mb/d quota for an extended period. World Bank pinksheet potash fell -41.2% MoM to $453/t, a move of that scale in a single month that materially alters the input cost calculus for the next Northern Hemisphere planting cycle. LNG Japan spot prices fell -6.2% MoM to $15.17/mmBtu, extending the softness visible in US LNG export volumes (-6.5% MoM). OFAC commodity-tagged SDN designations ran at 989 in the past 7 days and 3,832 over 30 days, with Persian Gulf marine insurance and navigation entities among the recent additions. The GSCPI at 1.25 (as of 2026-06) remains above zero, placing global supply chains in mild stress territory relative to historical norms. Corn ethanol use at 472 Mbu monthly provides a demand floor for corn even as futures prices fell -4.8% WoW, a structural offset that the WASDE S/U ratio does not fully capture.